

Cypress is ideal for testing Drupal content moderation, but the learning curve is rather steep. Well, with the cypress-json-tests package, you can be done within a couple of hours.
Hear about problems before your users do
Without monitoring, most problems go unnoticed until users start complaining. By then, the damage is done: a form that didn't submit, a page that wouldn't load, or a broken link on your most visited page.
We monitor in layers, from a simple check that the site is up to a review of content quality across thousands of pages.
What you get:
- Early warning. Problems are flagged as they happen, ideally before they spread.
- A record of what went wrong. Errors are kept for later analysis, so causes get fixed, not just symptoms.
- Content that stays healthy. Broken links and quality problems are caught as your site grows.
Our approach to monitoring

Check the site is up
The highest level of monitoring confirms the site is running. It can be as simple as a page returning a "200" response, or a check that a page contains an expected result.

Log and analyse errors
Your application and web server produce error messages from time to time. We keep them in a system where they can be reviewed later. We use tools such as Kibana to review logs, and Logstash to detect errors and alert us or take corrective action automatically.

Watch how search sees your site
Google Search Console reports on content problems, including broken links.

Track content quality
Tools such as Monsido and SiteImprove monitor content quality across many pages, which matters for large organisations.

Agree what happens next
Monitoring is only as useful as the response behind it. We agree on who's alerted, how quickly we respond, and how issues are escalated. See our support and maintenance service.
Frequently asked questions
Uptime and availability, performance such as page load times and error rates, security alerts, and increasingly accessibility and quality regressions caught by automated tools. Comprehensive monitoring means you know about a problem before users report it, not after.
A site assessment is a one-off diagnosis. Monitoring is continuous and automated, and catches issues as they appear. You need both: assessments for periodic deep reviews, monitoring for day-to-day assurance.
That depends on your support arrangement. Monitoring is only as valuable as the incident response behind it: who's alerted, how fast we respond, and how we escalate. That should be an explicit part of any support and maintenance agreement.
Case studies
Case study
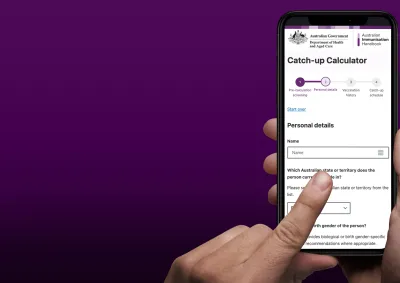
Morpht built the National Immunisation Catch-up Calculator, applying 80 rules across 75 vaccines and checked by 391 automated tests after every change.

Case study
Morpht rebuilt the TGA website on GovCMS, turning 95,000+ ARTG records into searchable pages and cutting 71 content types to 49 for 5.5 million monthly users.

Case study
Morpht connected NSW Trustee and Guardian's CRM, booking portal, Google Maps and Drupal, so pop-up service locations publish and expire automatically.

Case study
Morpht redesigned the ACECQA website, migrated its content and rebuilt National Register updates, cutting data processing by 99% and page load by 19%.
Latest insights
Article
This guide explains how to automate your Cypress tests for a Drupal site using GitHub Actions. We’ll cover setting up a full CI environment, connecting a MySQL database, running the Drupal server, and executing end-to-end Cypress tests - all inside GitHub’s cloud runners. You'll learn practical tips to speed up builds with caching and securely handle environment configurations.

Article
The Morpht CI pipeline caught a recent vulnerability in Drupal core which led to the problem promptly being fixed.

Article
How to increase the odds of a happy support outcome with a minimum of fuss.